
We, here at Host Unknown Headquarters (HUHQ: pronounced the same way as when Thom is trying to dislodge an exceptionally stubborn bit of phlegm from his throat) love the Verizon DBIR and look forward to it every year. The team put in a lot of effort and we all walk away educated.
The visuals are always well presented, but this particular image really got the lads talking this year. What does it mean? And what did it teach them?
Thom
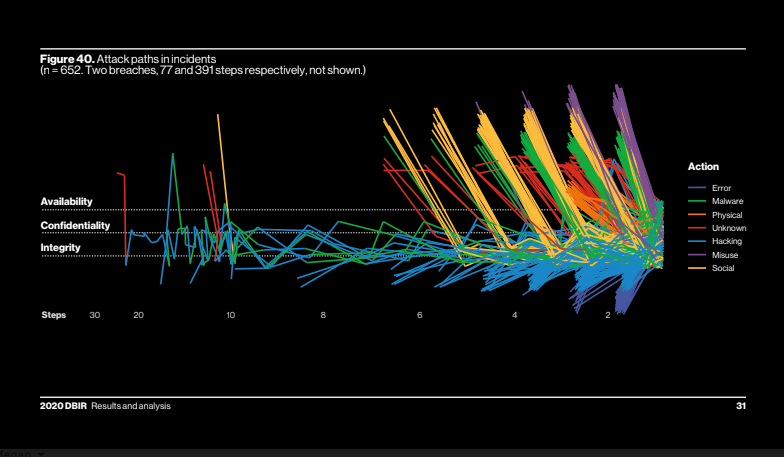
I learnt I have no idea what the graph actually means, or is trying to say.
Javvad
This reminds me of one of those ink blot tests. All I can see are six butterfly’s trying to recreate the human centipede.
Andy
I’m going to get that tattooed on my lower back!
Thom (again)
I learnt I STILL have no idea what the graph actually means, or is trying to say.
